Case studyAcademic
LungVision: multimodal lung cancer detection
A final-year team project that combines chest X-rays, CT scans and clinical metadata for early lung cancer detection, with four-CNN ensembles per imaging modality and Grad-CAM and LIME explanations for every prediction.
- 1st place, final-year project evaluation
- Presented at Techtatwa 2K25
- My role
- Flask REST API and model serving for the ensemble, with Grad-CAM and LIME explanations
- Team
- Team of 4
- Period
- Mar 2025 – Jan 2026
- Type
- Academic · Team of 4
The 30-second version
- Problem
- Lung cancer evidence is spread across chest X-rays, CT scans and a patient's symptoms; most student projects model only one of them, and few explain their decisions.
- My contribution
- Team of four. My part: the Flask REST API and model serving for the ensemble, returning predictions with Grad-CAM and LIME explanations.
- Approach
- Separate ensembles of four ImageNet-pretrained CNNs for X-ray and CT (softmax probabilities averaged), a small neural network for 15 clinical inputs, and two explanation methods.
- Results
- First place in the final-year project evaluation; presented at Techtatwa 2K25. Accuracy figures are not published because the training and evaluation code is not in the repository.
- Stack
- PyTorch
- torchvision
- Grad-CAM
- LIME
- Flask
- SQLAlchemy
- ReportLab
- Docker
- Gunicorn
Problem
Lung cancer is far more treatable when it is found early, but the evidence is spread across different sources: chest X-rays, CT scans and a patient’s symptoms and history. LungVision asks what a single system can do when it can look at all three, and how it can explain each decision to a clinician.
Team and my contribution
LungVision was our final-year project at Maharaja Institute of Technology Mysore, built by a team of four. It won first place in the final-year project evaluation and was presented at Techtatwa 2K25.
My part was the application layer: the Flask REST API that serves the ensemble models and returns predictions together with their Grad-CAM and LIME explanations. The models, datasets and evaluation were shared team work, so this page describes the system as a whole.
- Images across modalities
- 20k+
- Data modalities
- 3
- X-ray · CT · metadata
- CNNs per imaging modality
- 4
- averaged ensemble
- Clinical inputs
- 15
- symptoms & history
Data
| Modality | Source | Used for |
|---|---|---|
| Chest X-ray | Custom subset of the NIH Chest X-ray dataset | Four-CNN X-ray ensemble |
| CT scan | Custom subset of the NSCLC collection (TCIA) | Four-CNN CT ensemble |
| Clinical metadata | Public Kaggle dataset | Neural network on 15 inputs |
Architecture
Inference pipeline · select a stage
Stage 1 of 6 · Input
Upload and validate
The user chooses a modality and uploads a chest X-ray or CT image, or fills in the clinical form. Uploads are size-limited and stored under random identifiers.
- 16 MB upload limit
- UUID-based file names
- Separate form for clinical data
Stage 2 of 6 · Preprocess
Per-model transforms
The same image is prepared four ways, once per network, using each architecture's expected input size and normalisation.
- 300 px · EfficientNet-B3
- 299 px · Inception-v3
- 224 px · DenseNet-121 and ResNet-50
Stage 3 of 6 · Models
Four CNNs per modality
Separate X-ray and CT ensembles of EfficientNet-B3, DenseNet-121, Inception-v3 and ResNet-50, fine-tuned from ImageNet weights. The metadata branch is a small fully connected network.
- Classes: lung cancer, normal, and an 'unknown' reject class
- Metadata: yes / no output
Stage 4 of 6 · Ensemble
Average the probabilities
Softmax probabilities from the four networks are averaged; the consensus label and confidence come from the averaged distribution.
- Reduces the variance of any single model
- Per-model results are kept for inspection
Stage 5 of 6 · Explain
Grad-CAM and LIME
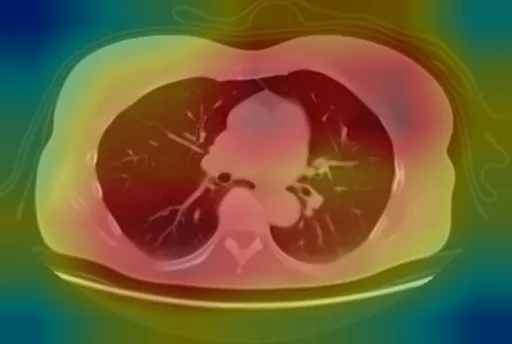
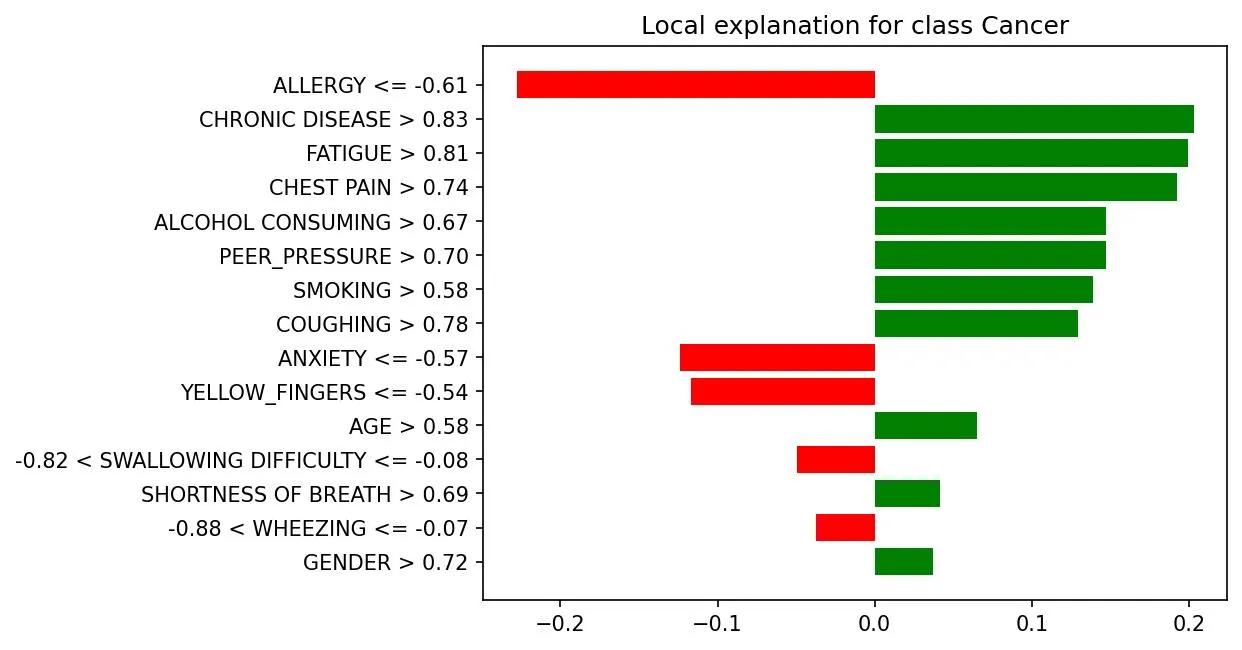
Grad-CAM produces a heatmap for each network. LIME perturbs SLIC superpixels to show which regions support the prediction, and explains the clinical-data prediction feature by feature.
- Grad-CAM on each model's last convolutional block
- LIME with superpixels for images
- LIME feature weights for metadata
Stage 6 of 6 · Output
Results and PDF report
The app shows the consensus prediction, confidence, per-model results and explanations, and generates a downloadable PDF report.
- PDF reports generated with ReportLab
- Optional Gemini-powered help assistant
Engineering decisions, with the code
Per-architecture preprocessing. Feeding every network the same 224 px image would quietly hurt the models pretrained at other resolutions, and Inception-v3 expects a different normalisation. One transform table keeps this correct and in one place:
model_transforms = {
    'EfficientNetB3': transforms.Compose([
        transforms.Resize((300, 300)),
        transforms.ToTensor(),
        transforms.Normalize([0.485, 0.456, 0.406], [0.229, 0.224, 0.225]),
    ]),
    'InceptionV3': transforms.Compose([
        transforms.Resize((299, 299)),
        transforms.ToTensor(),
        transforms.Normalize([0.5, 0.5, 0.5], [0.5, 0.5, 0.5]),
    ]),
    # DenseNet121 and ResNet50: 224 × 224 with ImageNet normalisation
}
Averaging probabilities, not votes. Different architectures make different mistakes. Averaging the softmax outputs gives a steadier consensus and a meaningful confidence, while each model’s own result is kept so a reviewer can see when they disagree:
avg_probs = torch.stack(probabilities).mean(dim=0)
consensus_conf, consensus_pred = torch.max(avg_probs, 0)
consensus_label = class_names_list[consensus_pred.item()]
An explicit “unknown” class. Users can upload anything. The image models output a third, reject class, so the system can say “this does not look like the expected scan” instead of forcing a cancer/normal answer.
Serving eight large CNNs in one web process. Models are loaded once at start-up rather than per request, and Gunicorn runs with model preloading and long timeouts, so the first prediction is not penalised.
Evaluation
The team evaluated the models with accuracy, ROC curves, Cohen’s kappa and confusion matrices. I am not publishing figures here because the training and evaluation notebooks are not part of the public repository, so the numbers cannot be checked against code. They will be added once that evidence is published.
Explainability: what the outputs show
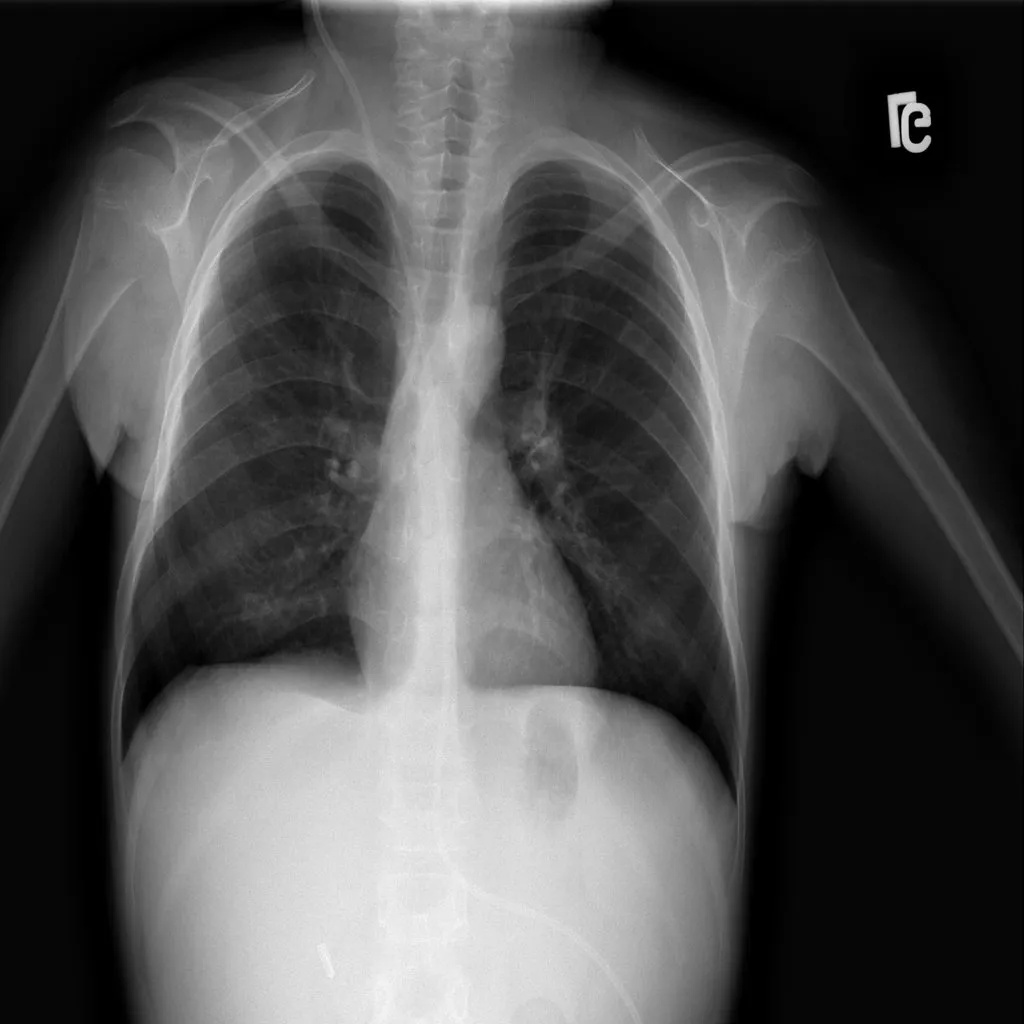
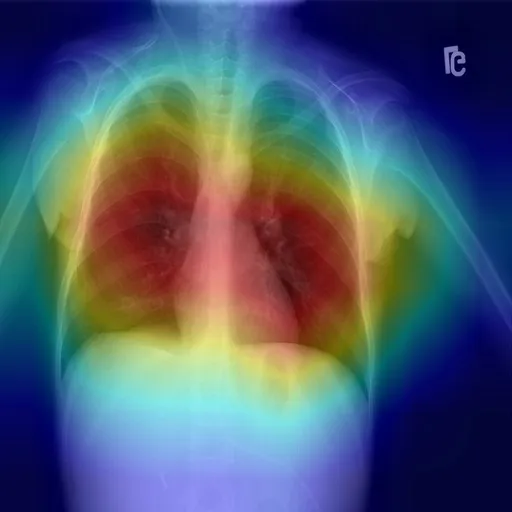
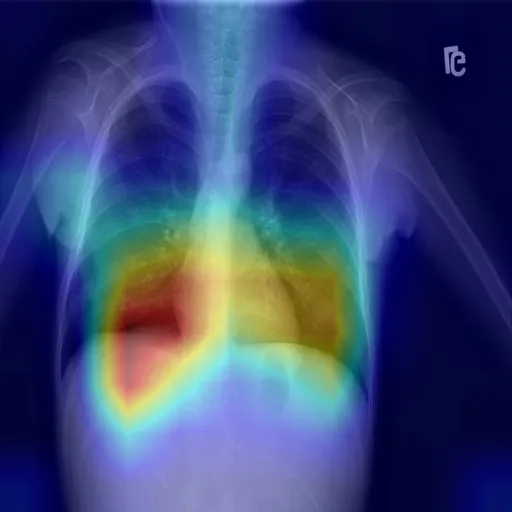
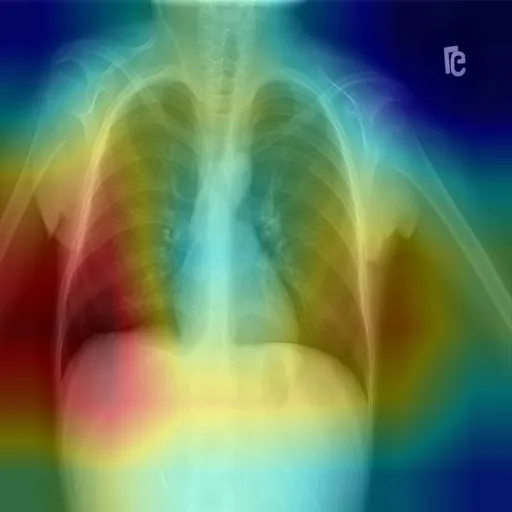
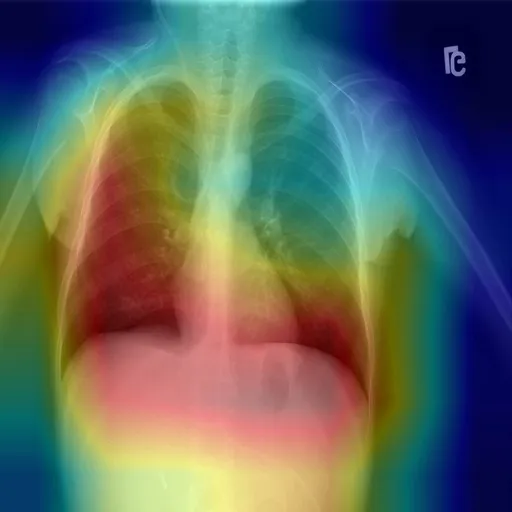
Every image prediction returns a Grad-CAM heatmap and a LIME explanation for each of the four networks. The figures below are real outputs from the app for one uploaded X-ray.
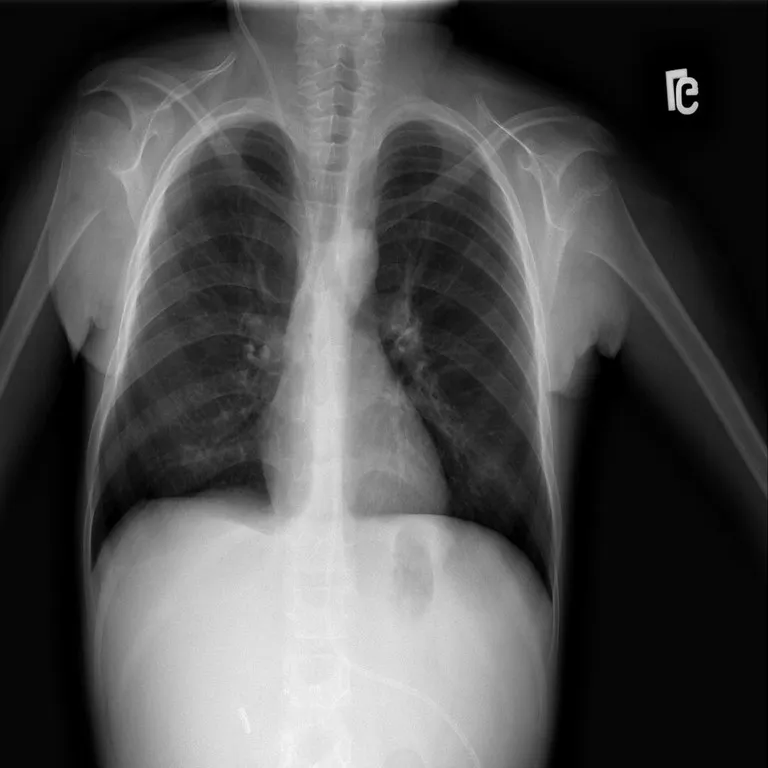
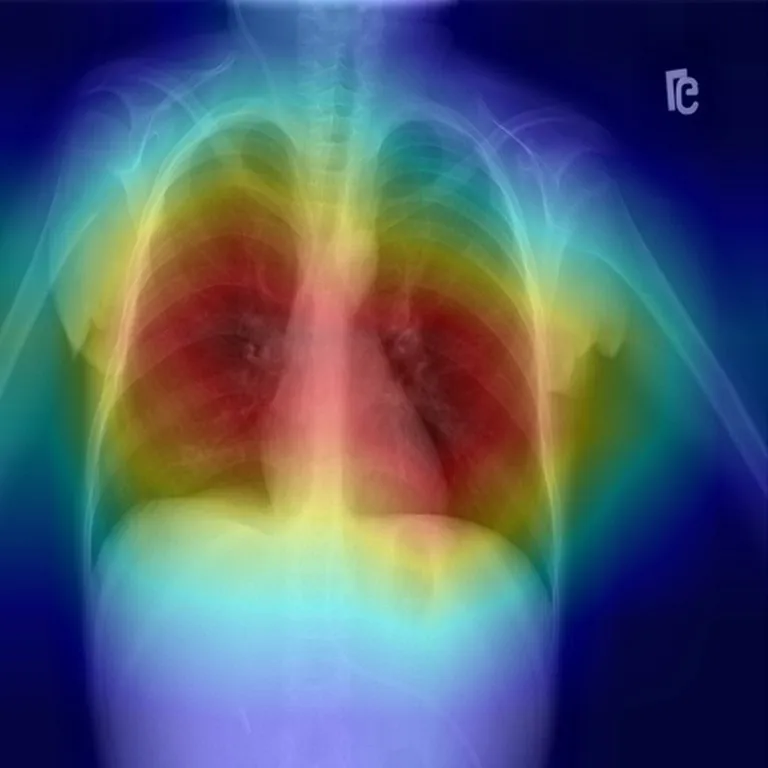
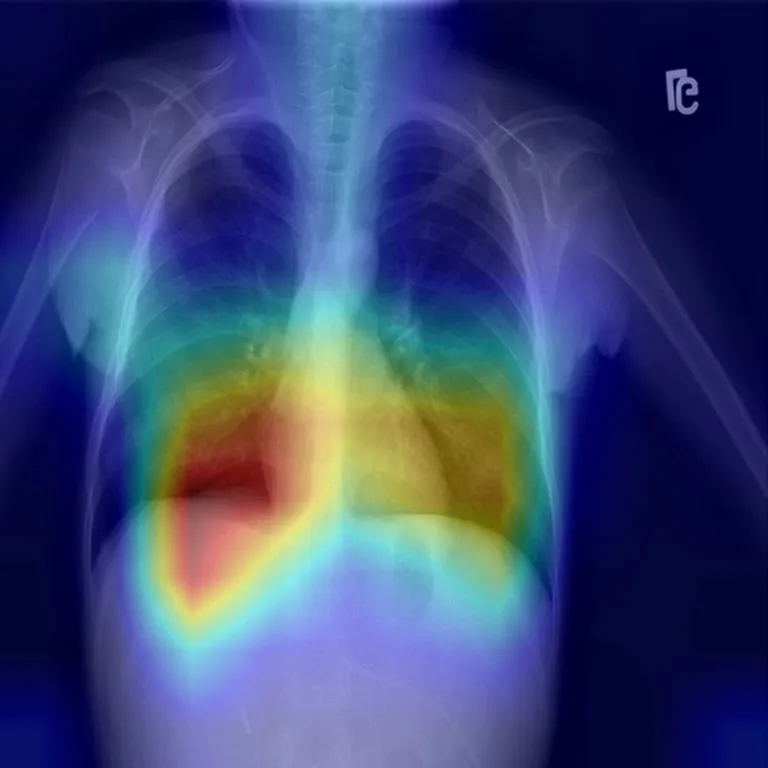
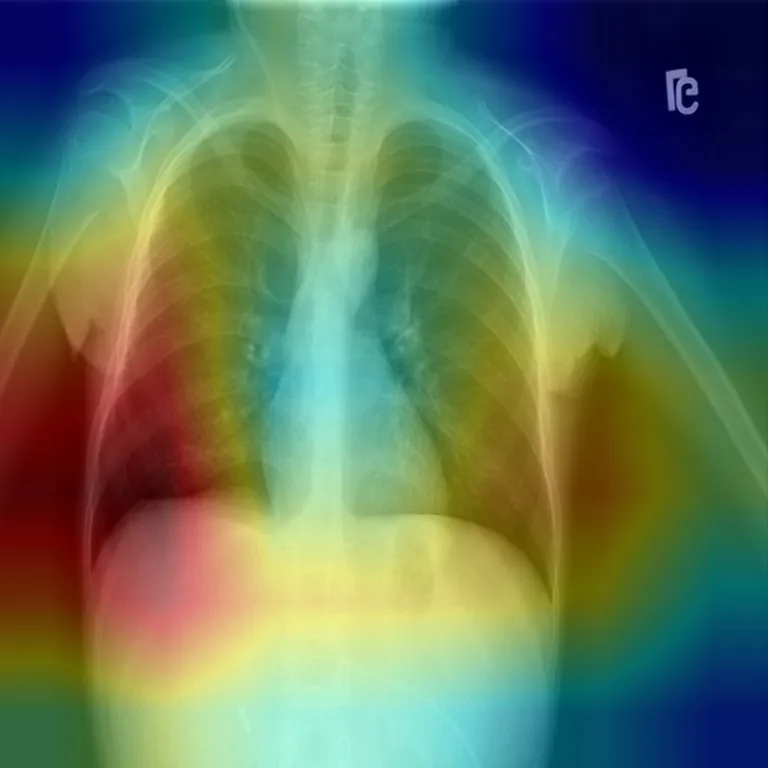
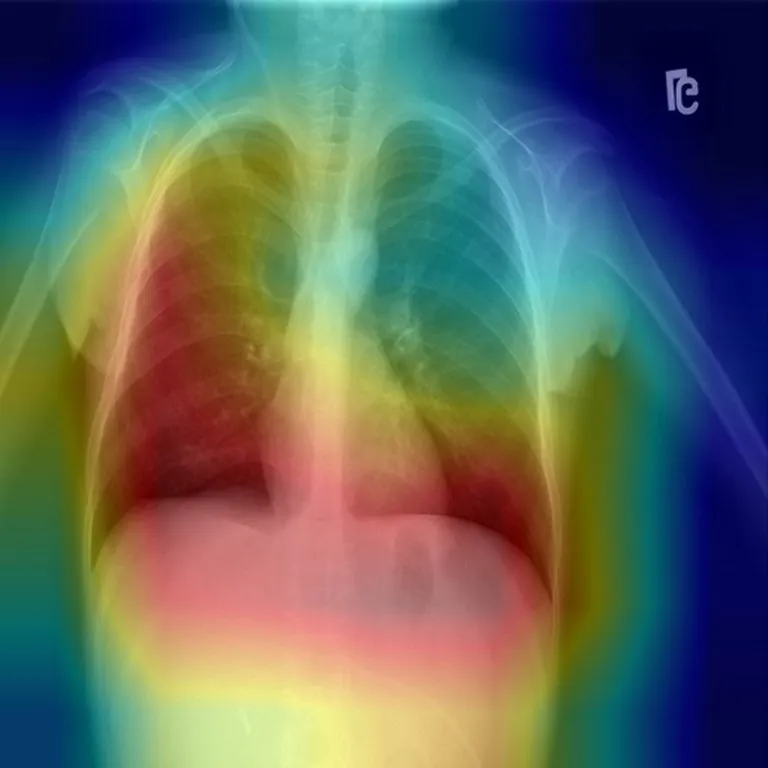
Read correctly, the four networks attend mostly to the chest, but each looks somewhere different: one low near the heart border, one along the chest wall on the left of the image, one across both lung fields, one extending below the diaphragm. (The app does not label which file came from which architecture, so they are shown as A–D.) The averaged prediction hides this disagreement, which is a good argument for showing per-model explanations to reviewers.
Ensemble lens · one scan, four saved outputs
LIME is far less consistent. The app saved four LIME outputs for this scan, one per model run, and they barely agree:
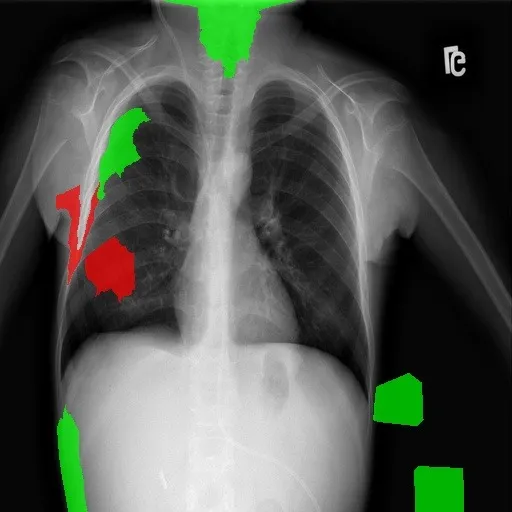 Run 1
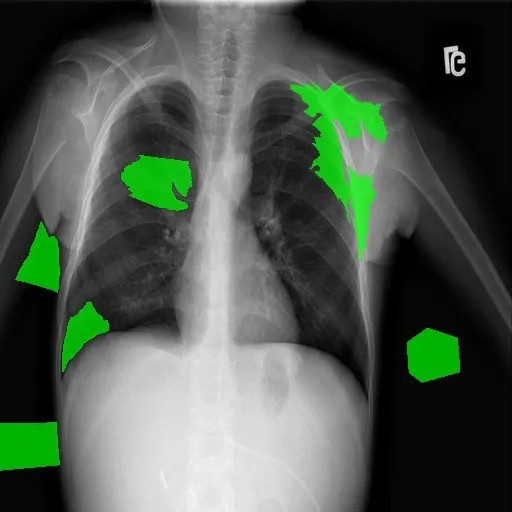 Run 2
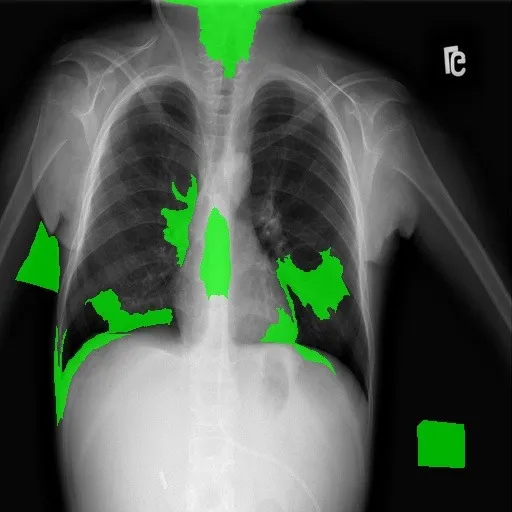 Run 3
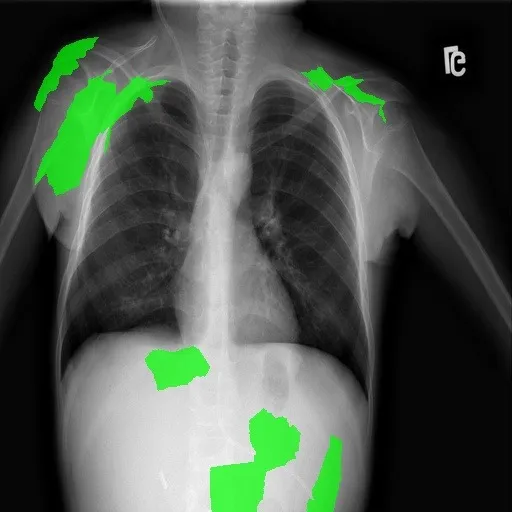 Run 4
Some runs place supporting superpixels inside the lung fields; others place them on the shoulders, the image edge, below the diaphragm or outside the body. Because the app does not record which LIME file came from which model, this variation cannot be split into “different models” versus “LIME’s own random sampling”, and no LIME run can be paired with a particular Grad-CAM above. What the evidence does support is narrower: these LIME explanations are too unstable to support conclusions on their own, and the off-lung regions that appear in some runs are a reason to test for shortcut learning, not proof of it.
The full analysis, including how the colour bug nearly led to the wrong conclusion and how LIME stability was measured, is in What Grad-CAM revealed about shortcut learning.
Application and deployment
- Flask application with registration and login (bcrypt-hashed passwords, SQLAlchemy), a diagnosis workflow per modality, and explanation views.
- PDF reports that combine the prediction, confidence, explanations and plain-language clinical insights.
- Help assistant using the Gemini API, with fallback responses when no API key is configured.
- Containerised with a Dockerfile and Docker Compose: Gunicorn workers, models preloaded at start-up, and a container health check.
Challenges, trade-offs and lessons
- Averaging buys stability but hides disagreement. The consensus is steadier than any single model, yet the per-model explanations show the networks attend to different regions. Both views belong in front of a reviewer.
- Explanations need the same review as metrics. A one-line channel-order slip inverted every Grad-CAM. Without reading the overlay code, the heatmaps support the opposite conclusion.
- Check explanation stability before reading meaning into it. The four LIME runs on a scan barely overlap; a single run would have told a confident but unreliable story.
What I would do next
- Fix the overlay colour order in the app.
- Segment or crop the lung fields before classification, then measure how much attribution falls outside them, using repeated LIME runs with a fixed seed per model so stability can be reported.
- Quantify explanations across the test set (for example, the share of activation inside a lung mask) instead of inspecting examples.
- Split data by patient, calibrate the ensemble’s probabilities, and publish the training and evaluation notebooks.
Repository
The application code is on GitHub.